
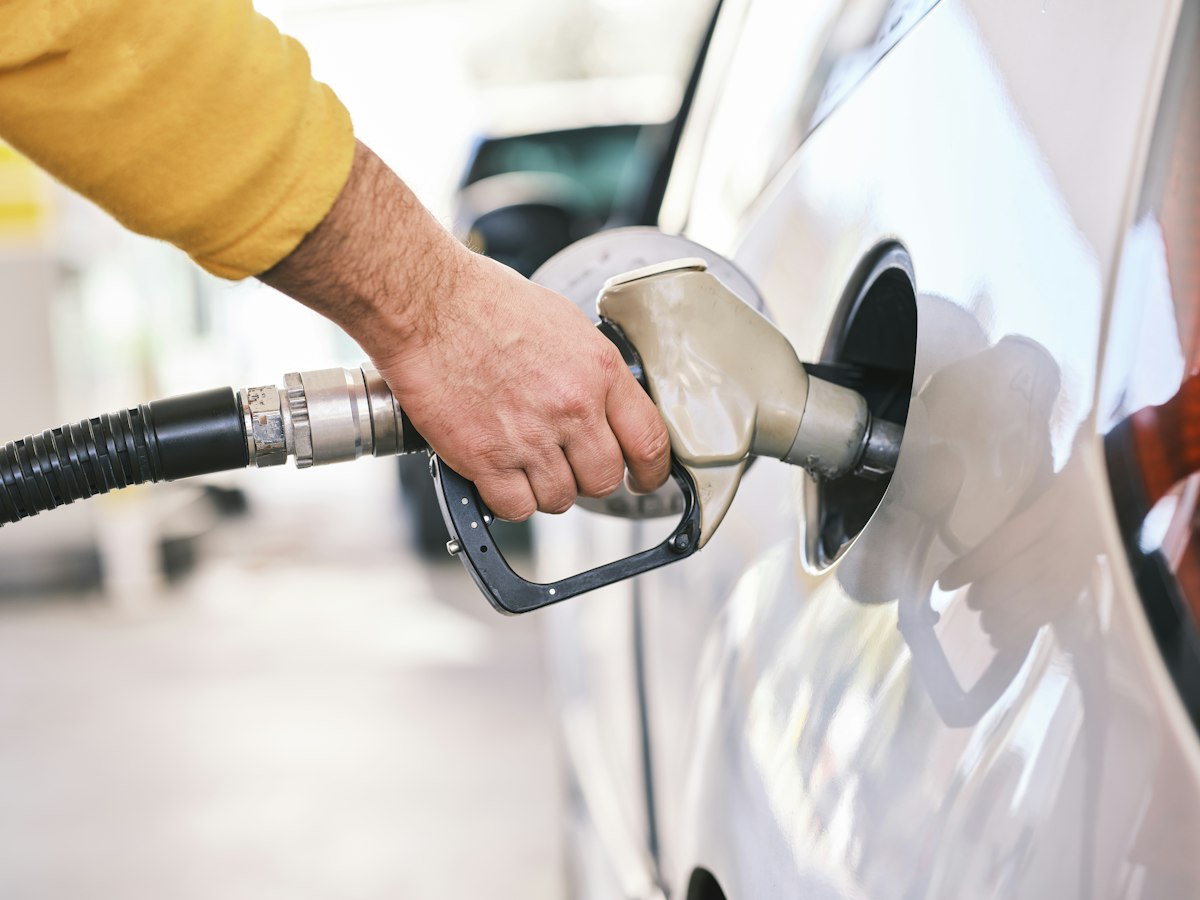
Fuel economy is the rare measurement where two conventions disagree about direction. Europe, Canada, Australia, and most of the world use consumption: liters per 100 km (L/100 km), where lower is better. The US and UK use efficiency: miles per gallon (mpg), where higher is better. Converting between them in your head is nearly impossible, which is why a rental car rated "7,8" looks confusingly similar to one rated "7.8".
The two systems
- L/100 km: liters of fuel burned per 100 km driven. A consumption figure: how much you spend per distance. Lower = better.
- mpg (US): miles per US gallon (3.785 L). An efficiency figure: distance per fuel unit. Higher = better.
- mpg (UK): miles per imperial gallon (4.546 L). About 20% higher than US mpg for the same car, purely because the gallon is bigger.
Conversion table
| L/100 km | mpg US | mpg UK | Typical vehicle |
|---|---|---|---|
| 3.5 | 67 | 81 | small hybrid, city |
| 5.0 | 47 | 56 | efficient compact |
| 7.0 | 34 | 40 | compact petrol, midsize hybrid |
| 9.0 | 26 | 31 | average sedan, small SUV |
| 12.0 | 20 | 24 | large SUV, van |
| 15.0 | 16 | 19 | performance car, big pickup |
The exact formula: mpg US = 235.215 ÷ (L/100 km). For UK mpg: 282.481 ÷ (L/100 km). Or skip it: L/100 km → mpg US.
The US vs UK gallon trap
A UK gallon is 4.546 L, a US gallon 3.785 L. A car quoted at "40 mpg" in Britain achieves 33 mpg US. Magazine comparisons, imported cars, and forum posts mix these constantly. Any time you see mpg without a country, assume US if the source is American, UK if British, and verify with the symbol: "mpg (imp)" or "mpg UK" signals the imperial figure.
Why mpg math misleads
Because mpg is a ratio, equal improvements are not equal. Going from 20 to 25 mpg saves 1 gallon per 100 miles. Going from 34 to 39 mpg saves 0.38 gallons per 100 miles, the same jump of "5 mpg" is worth less than half as much. In L/100 km terms (12.4 → 9.4 vs 7.0 → 6.0), the truth is visible: consumption improvements translate directly into liters saved. This asymmetry is the main reason Europe standardized on consumption.
Real-world figures vs brochure figures
- WLTP (Europe) and EPA (US) lab figures are typically 10-25% optimistic for petrol cars, more for hybrids at highway speed
- Cold weather costs 10-30% efficiency (petrol) and up to 40% (EVs)
- Roof boxes and underinflated tires cost 5-15%
- The honest comparator is your own hand-calculated figure: full tank, note the odometer, next full tank: liters ÷ km × 100
Convert right now